

Before you even start sending web push notifications, you need to know how to measure their results. Otherwise, how do you know if it was worth the effort?
We review major push notifications performance metrics and how you can measure and improve them.
Why do you need to get familiar with push notification metrics?
With the data from the push notifications metrics, you’ll be able to analyze your push campaigns and improve their performance over time by adjusting your campaigns to reflect subscriber behavior. For example, you can check if your click-through rate depends on adding buttons and big images or what content shapes the most interest. This information helps improve your push marketing campaigns and better understand your website audience to implement this knowledge for other marketing channels such as emails and other types of push notifications.
Here are seven essential push performance metrics.
- Opt-in rate
- Delivery rate
- View rate
- Click-through rate
- Opt-out rate
- Time spent on page
- Conversions
Statistics on Opt-in rate, Delivery rate, View rate, Click-through rate, and Opt-out rate are provided by push notifications services. Time spent on page and Conversions statistics you can track with Google Analytics.
If you haven’t used push notifications before, there’s nothing to compare your results to. You can use push notifications benchmarks for your industry as a starting point for evaluating your first results. In order to improve your results, push notification best practices are beneficial. Once you have some experience and statistics on your campaigns, you’ll be able to experiment with push notifications and create unique tactics to boost your campaigns’ performance.
Moving from item to item in our list, we will show you their averages and how to improve each metric.
Delivery rate
The delivery rate is a ratio of the number of delivered and sent notifications. A notification is delivered if a server (Google, Apple) confirms that a subscriber is in your base. So, the number of delivered notifications is the current number of your subscribers. A delivery rate for Gravitec.net users (over 10,000 websites) is 80-99%.
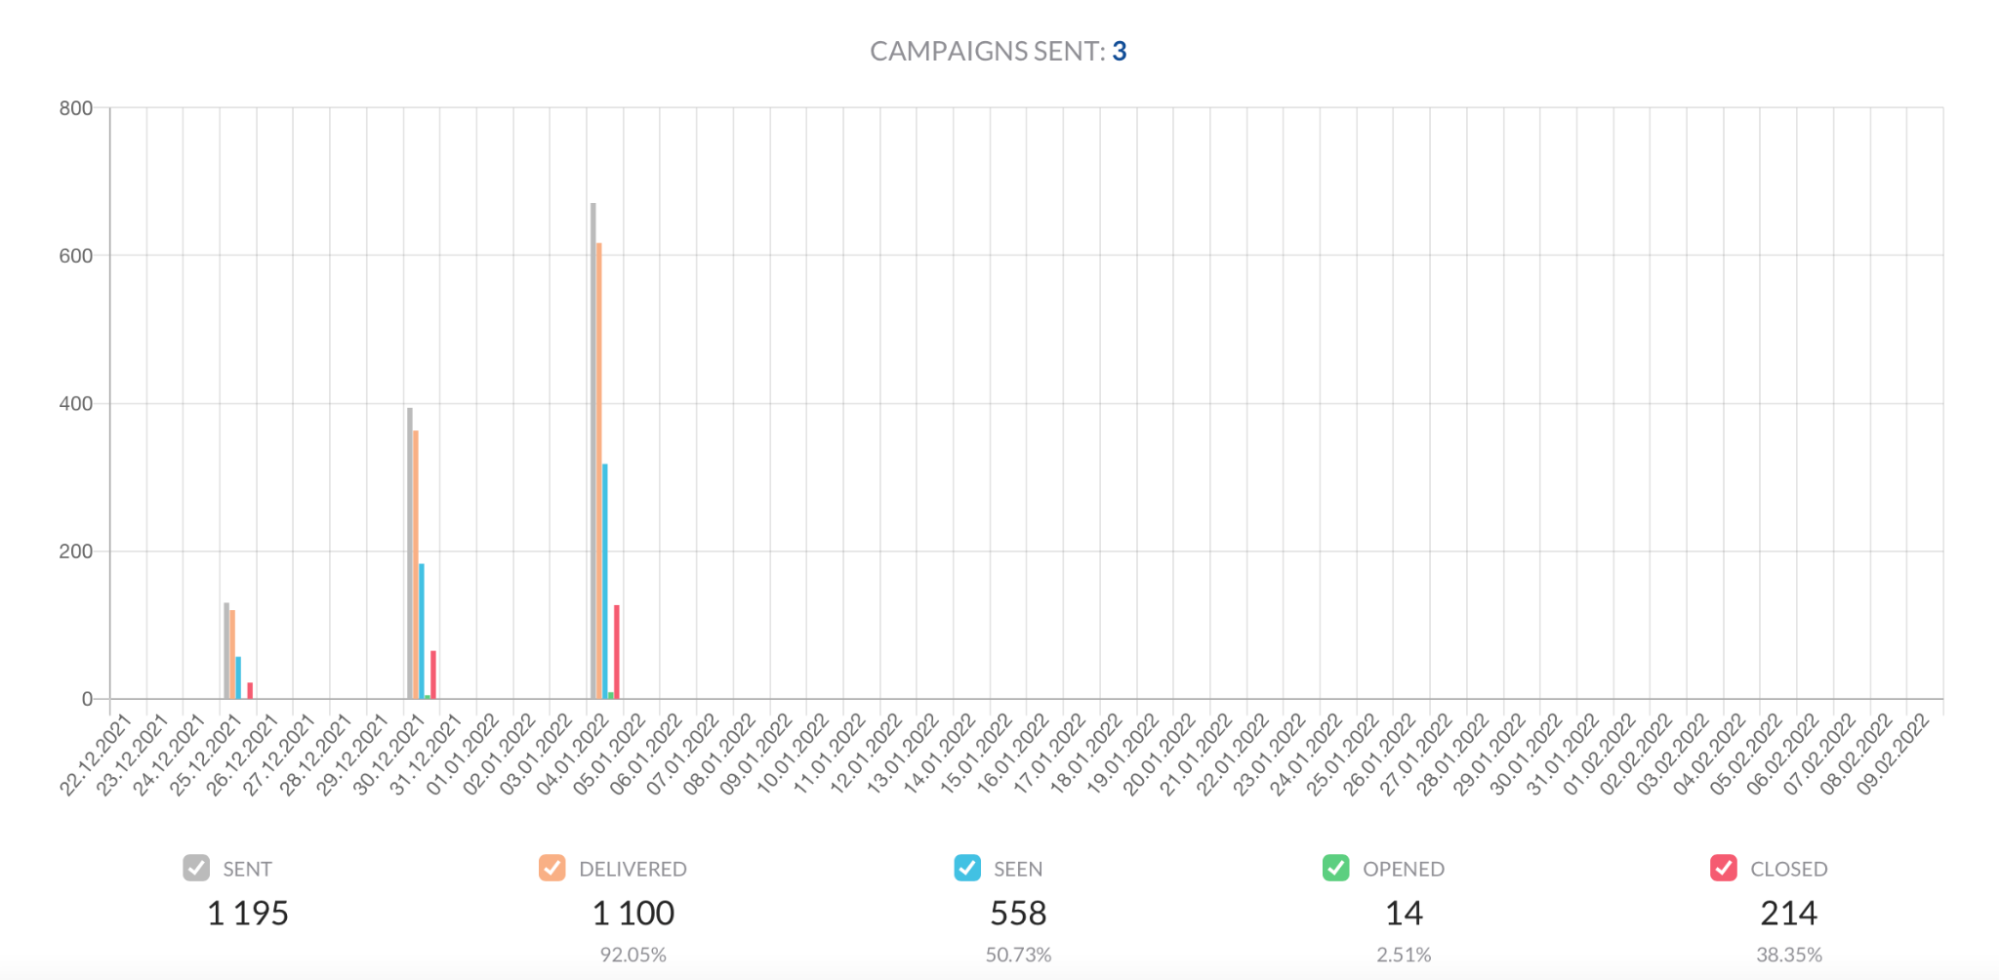
A report example from the Gravitec.net dashboard with the number of sent, delivered, seen, opened, and closed notifications and rates in percent. The delivery rate here is 92.05%.
Opt-in rate
Opt-in rate shows how many visitors subscribe to your push notifications. It’s calculated as a ratio of the number of subscriptions and website visits per a certain period of time. An average opt-in rate for web push notifications is up to 5% for eCommerce, up to 6% for media websites, and up to 10% for the financial industry. Check out more push notification statistics. Typically, in two to three months after push notifications are added, Gravitec.net users get a dramatic increase in the number of subscriptions up to 300% each month. After the core website audience subscribes, the opt-in rate increase gets lower, which is totally normal. After the initial surge, your number will be more reliable, and you can increase it by customizing your permission prompt.
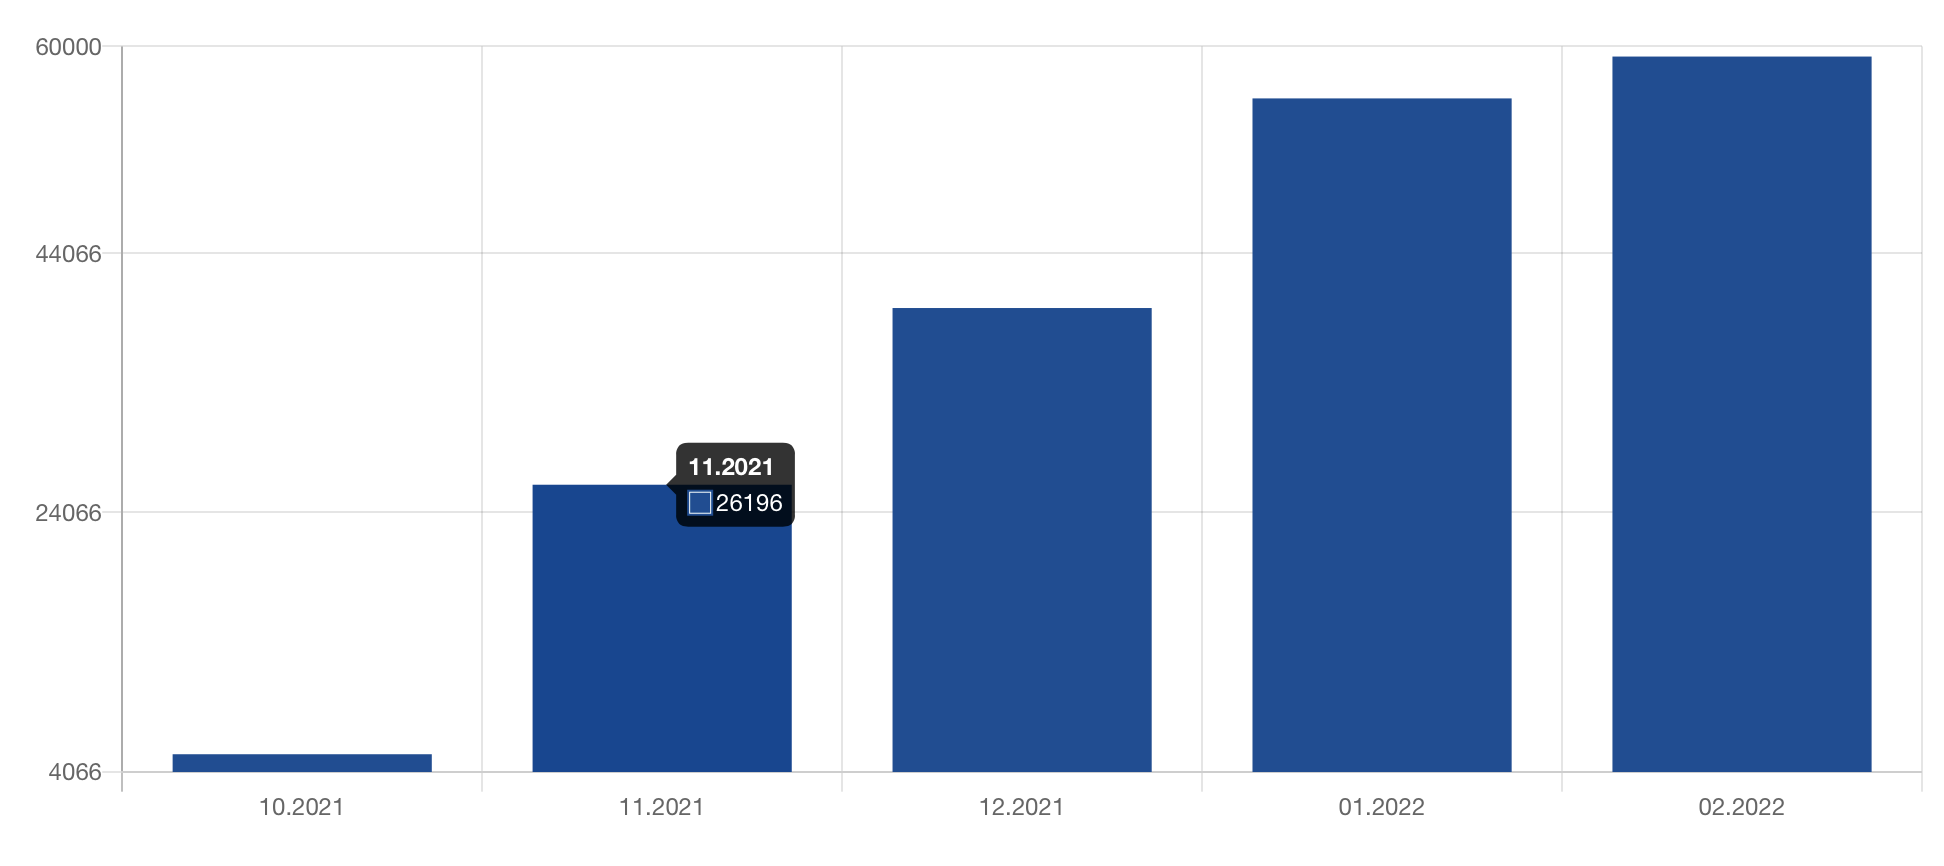
Here is a sample of opt-in statistics in the Gravitec.net dashboard.
The Gravitec.net customer added push notifications in October 2021, and the number of subscribers had a sharp rise for the first three months. After three months, the pace slowed, and the opt-in rate became stable.
Tips to improve performance. You can impact your opt-in metrics by choosing different permission prompts. In the Gravitec.net dashboard, there are four prompt types: native, modal, toast, and subscription bel that you can set up separately for desktop and mobile. Plus, you can experiment with location, text, and button colors. After Google launched Quieter permission UI for Chrome, we recommend using the toast prompt with double-click opt-in. 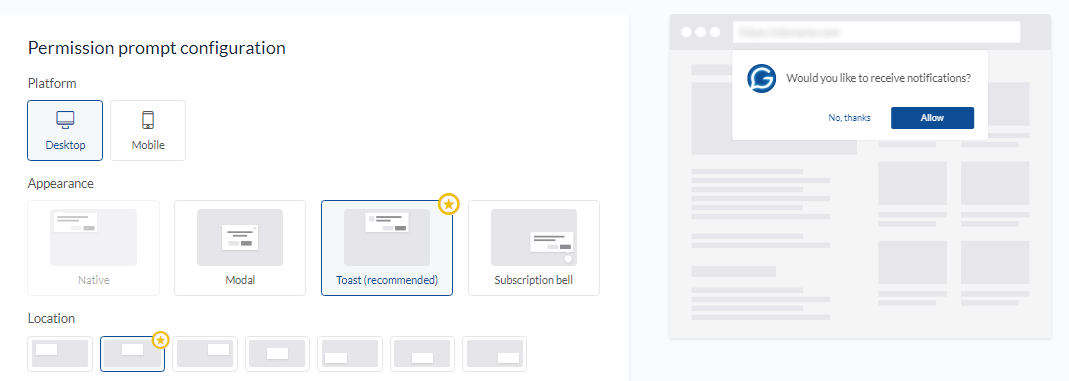
Opt-out rate
The opt-out rate shows how many users unsubscribe from your push notifications. It is a ratio of the number of subscriptions and opt-outs. An opt-out largely depends on your push notification content and timing when you send campaigns. But even if you apply the best push notification practices, unsubscribes will happen; it’s natural.
Tips to improve performance. To reduce the number of unsubscribes, first, you need to think thoroughly about when to send notifications. If your notifications pop up at inconvenient times, the risk is to be banned by a subscriber. We recommend checking when your visitors opt-in the most frequently to determine when they’re active and schedule your campaigns for this time. Don’t forget to use time zones! Learn more about push notification time settings. Another factor that influences opt-outs is the relevance of your push notifications content to subscriber interest. The segmentation feature will help you target your content to the right subscribers. Learn more on how to reduce unsubscribe rates.
View rate
The view rate shows how many subscribers received your notification. It’s a ratio between the number of seen notifications and the number of notifications delivered to subscribers. A subscriber will not receive a notification if their device is off/inactive/offline when your push campaign runs. Subscribers who changed their device or updated the browser/operating system are also off the list of recipients. The view rate for Gravitec.net users is up to 60%.
Tips to improve performance. To increase your view rate, you need to delete inactive subscribers from your base regularly. This not only improves your statistics but also saves your budget on push notifications if your price plan is tied to your current number of subscribers. Luckily, Gravitec.net automatically refreshes your subscriber base by deleting subscribers who were inactive for 90 days. Plus, if you’re into predictable budgets for marketing tools, try the Gravitec.net fixed plans that start at $8,99 per month for 30,000 subscribers.
Click-through-rate (CTR)
CTR is calculated as a ratio of the number of opened and seen push notifications. It’s the most important metric as it shows how many people clicked your notification and opened your web page. The average CTR for web push notifications is roughly 15%. For standard campaigns, such as promoting a new blog post for all of your subscribers, CTR is up to 5%. Transactional and targeted campaigns have a much higher CTR that is up to 30%.
Tips to improve performance. Three things affect your CTR: who you send campaigns to, timing/frequency for sending notifications, and push notifications content.
- To send notifications to the right people, you need to segment your subscribers.
- At what times to send notifications depends on your audience’s behavior. To determine the best time try using subscription statistics and sending campaigns at different times. For information on optimal frequency, see here.
- Creative push notifications content shapes more interest than sending the same image, title, and description for each campaign. We recommend previewing your notification before sending it to ensure that it complies with different browsers’ push notification character limits. If you’re looking for ideas to create stunning notifications, check out a compilation of push notifications examples.
People who visit your website by clicking on web pushes provide you with the most valuable information, such as the number of sessions, conversions, and time spent on the page. You can monitor how your visitors behave by using Google Analytics, at least until analytics is banned in your region over U.S. data spy fears.
To see push notification statistics in Google Analytics, you need to add a UTM tag to your target URL when sending a notification. You can add a UTM tag with the Gravitec.net push notification service when creating a campaign. Learn more on how to send push notifications.
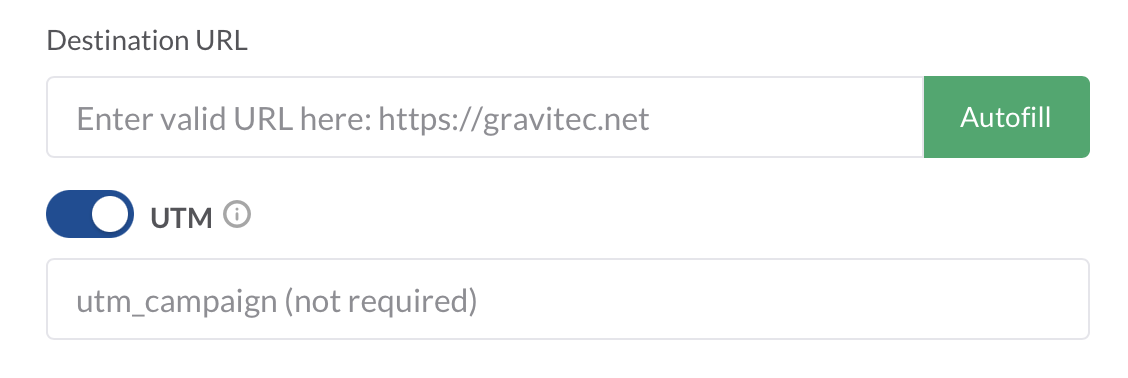
A UTM tag will be added to your destination URL
You’ll find push campaign statistics by the UTM tag name among Campaigns in Google Analytics.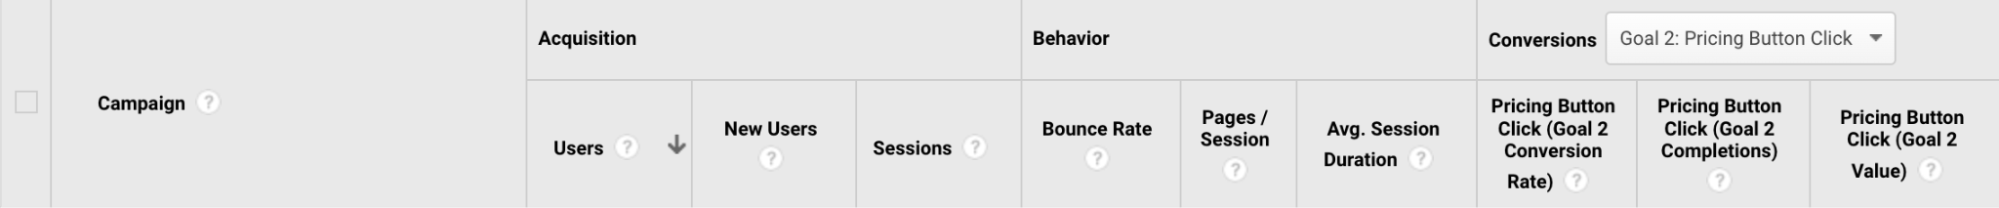
Here you can monitor many metrics for push notification campaigns, such as the number of users and sessions, session duration, and conversion rate. The number of users will be nearly equal to the number of clicks. So, we’ll discuss session duration and conversion rate as push notifications metrics.
Time spent on page
An average session duration shows you the time push subscribers spend on your page. This will give you insight into whether your target web page was interesting to your subscribers.
Tips to improve performance. Make your push notifications relevant to your subscribers’ interest by using the segmentation feature. Plus, create a web push title and description to be consistent with your target page content not to mislead your subscribers.
Conversion rate
Conversion rate is a ratio of completed conversions to the number of users who clicked on your push notification. It’s the most valuable metric that shows how your subscribers behave for the target action, such as clicking on a button or completing the purchase.
Tips to improve performance.
- Use proficient marketing tactics such as up-sell and cross-sell for eCommerce.
- Set up drip campaigns to nourish your leads.
- Create subscriber segments and target your push notifications to the right audience.
- Ensure that your target page is optimized for getting conversions.
Wrapping Up
To sum up, we’ve compiled a brief list of metrics with tactics to improve your push performance.
- Opt-in rate shows how often your website visitors give permission to send them push notifications. Customize your permission prompts to impact your opt-in rate.
- Delivery rate shows your current number of subscribers after you send a campaign.
- View rate indicates how many subscribers receive your notification. To improve this metric, you need to clean out your subscriber base of inactive subscribers.
- Click-through rate shows how many subscribers clicked on your notification. Improve CTR by applying the best push notification practices such as creating helpful content, sending notifications at the right time, and sending targeted campaigns.
- Opt-out rate indicates how many subscribers opt-out from your notifications. To reduce the number of opt-outs, send notifications relevant to your subscribers’ interest and choose the time of their convenience.
- Time spent on the page shows how long your subscribers visit your target page. It is a metric that you can monitor in Google Analytics. To improve it, make your notifications content consistent with your target page. And, again, use the segmentation feature!
- Conversion rate indicates how many clicks on push notifications lead to conversion. Use cross-sell and up-sell techniques, send drip campaigns and target them to the right audience to improve your conversion rate.
FAQ
- Are push notifications effective?
Push notifications are the best way to re-engage website visitors and increase the number of returning visitors to your website. Averagely, push notifications increase website traffic by up to 25%. Push notifications are also effective in recovering abandoned carts and delivering urgent messages to your users.
- How do I increase push CTR?
You can increase push notification CTR by applying the best push notifications practices such as choosing the best time and frequency to send notifications and creating targeted campaigns.
- What is the best time to send a push notification?
On average, the best results for push campaigns are from 11 a.m. to 6 p.m. But, the best time to send push notifications largely depends on your industry and your website audience. So, the best tactic is to test at what times you’ll get the best CTR for the same campaign.