

In 2016, the Gravitec.net company released the first version of its web push service. Since then, we have collected a lot of data and web push notification statistics that we want to share to inform you how people use notifications for their websites and what results they get.
Try Gravitec.net for your website
This guide shows you web push notification statistics that are based on data extracted from the Gravitec.net web push notification service in 2022. In the Gravitec.net overall base, in 2022, it was more than 50 million subscribers from all over the map.
So, this guide will give you proven information and understanding of how people actually use mobile and desktop web push notifications, what browsers and devices are the most popular among push subscribers, when it is the best time to send notifications, and much more.
So, let us get started!
General information about web push notifications
Firstly, web push notifications are supported by all the popular browsers such as Chrome, Firefox, Safari, Opera, and Edge on desktop (Windows, Linux, MacOS) and mobile devices (Android).
So push notifications can reach roughly 85% of all internet users.
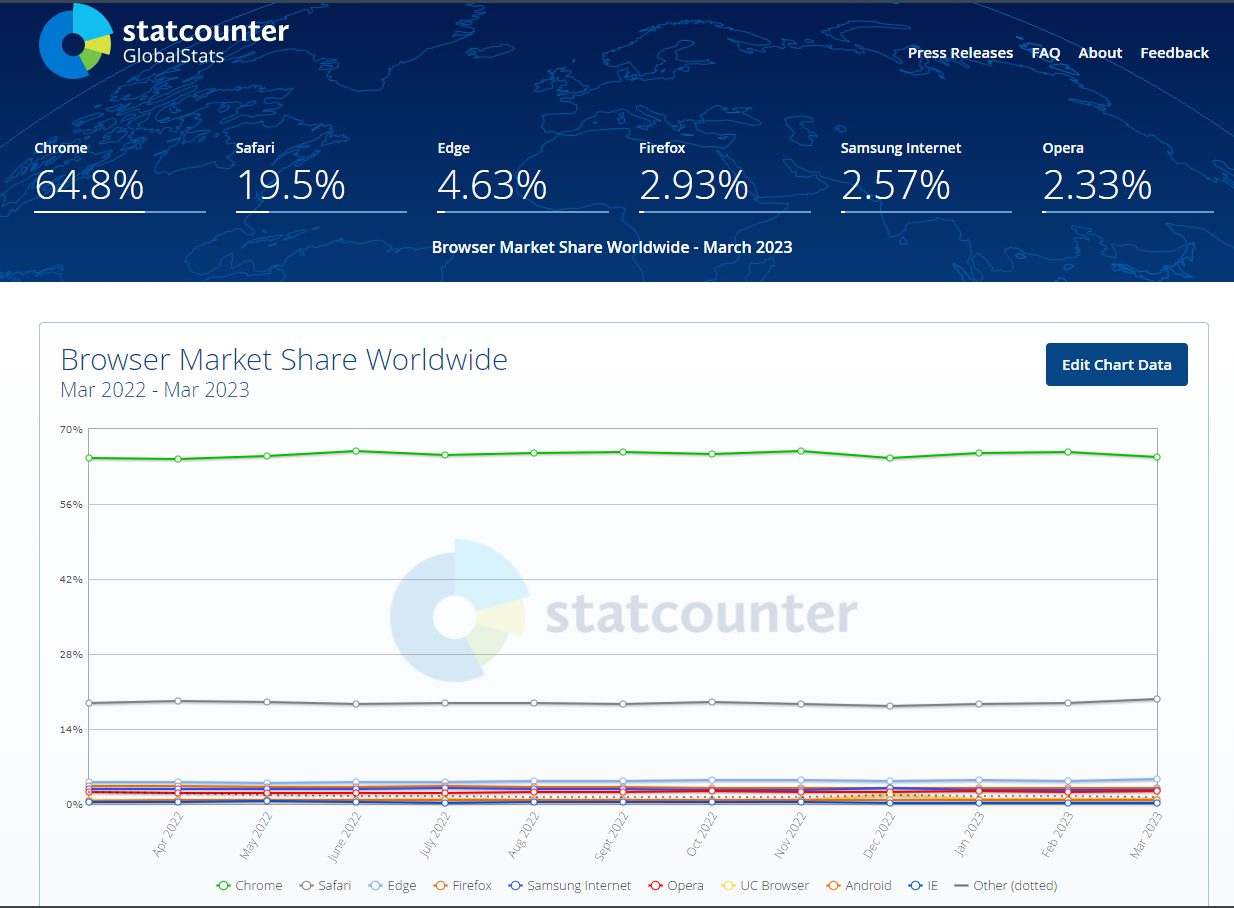
Source – https://gs.statcounter.com
TIP
The key metrics for evaluating the effectiveness of push campaigns in the Gravitec.net service are opt-in rate, delivery, view rate, and click-through rate.
These metrics are calculated based on the number of delivered, seen, opened, and closed notifications. 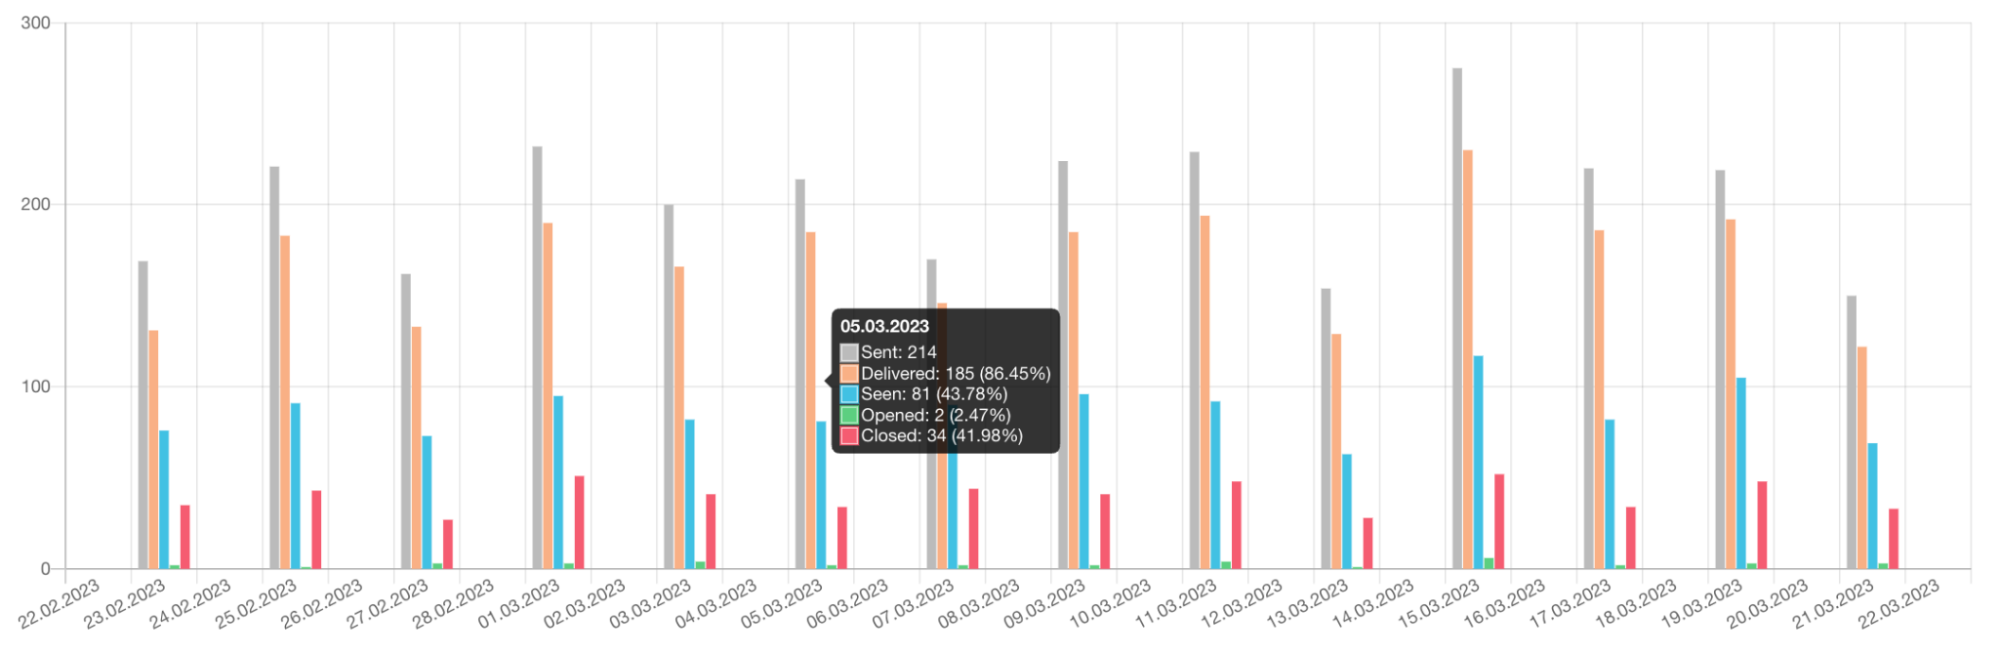
Also, in the Gravitec.net dashboard, you can see the number of subscribed and unsubscribed users. 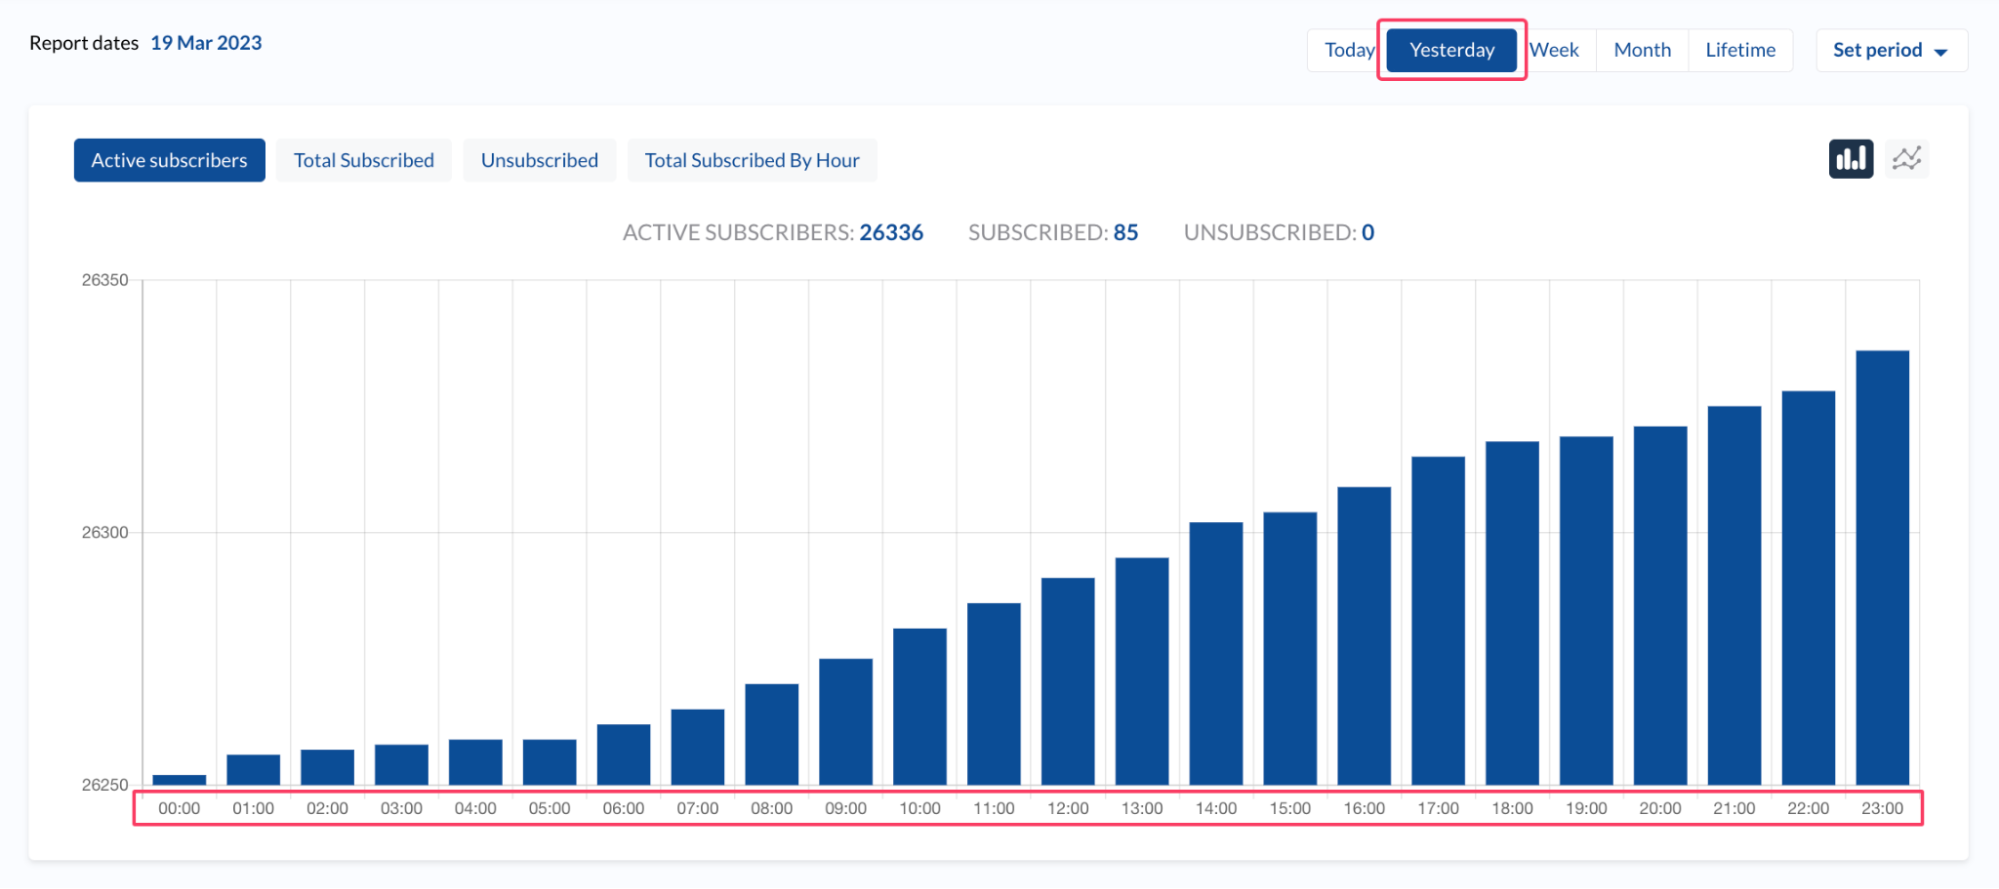
The following statistics are based on the above metrics and on metadata from browsers such as subscriber devices and browsers. We have explored the numbers for general and targeted campaigns, for standard and rich push notifications to give you the whole picture of how push notification subscribers behave.
Push notifications opt-in statistics
The opt-in rate is a ratio between the number of subscriptions and the total number of website visitors.
An average opt-in rate depends on the period when you measure this metric. Generally, within the first three months after the installation of push notifications, the number of subscriptions in a base grows by up to 300%. After this period, the opt-in rate slowly decreases because a website core audience has already become push subscribers.
Also, the opt-in rate depends on the industry. Within the first three months, it is up to 5% for e-commerce websites and 6-8% for media websites.
Browsers and devices
In 2022-2023, almost 90% of all push subscribers used mobile devices to subscribe to push notifications. The share of desktop devices among push subscribers is roughly 10%.
In the chart below, you can see the smooth shift towards mobile devices since 2018.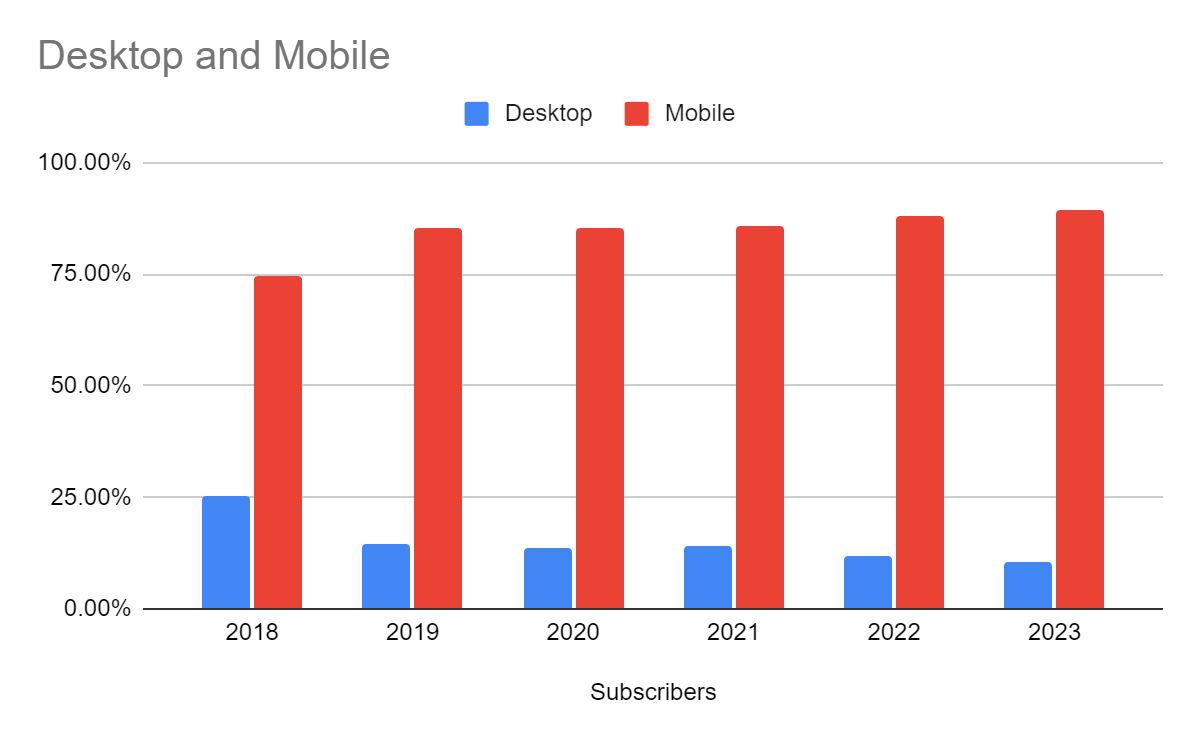
Among the mobile devices are phones and tablets based primarily on Android, but there are also Windows Phone, Ubuntu Touch, Firefox, and BlackBerry operating systems.
Desktop devices from a sample are primarily based on Windows but also on Linux, Mac OS, Chrome OS, and others.
The most commonly used browser is Chrome. In 2022, over 95% of all push subscribers received notifications through the Chrome browser.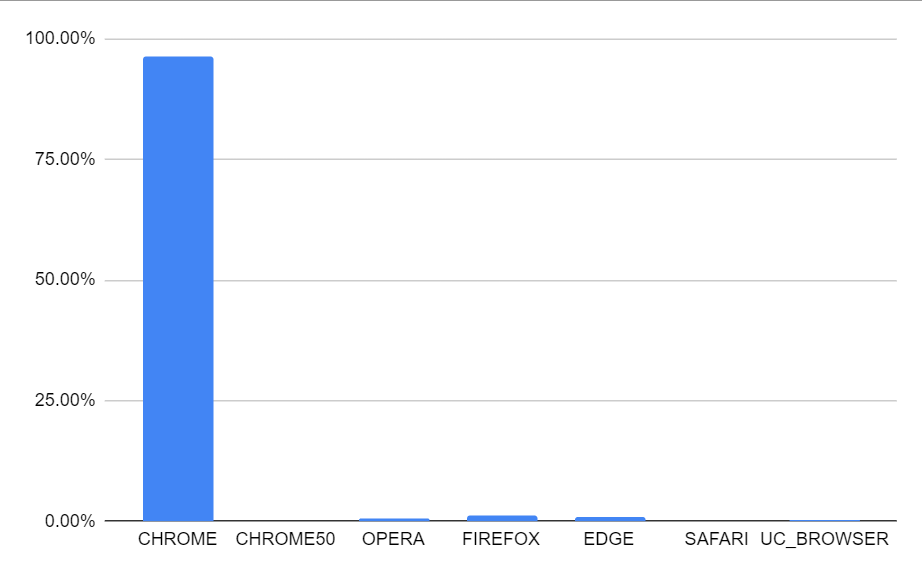
Average delivery and view rate
In the Gravitec.net dashboard, you need to distinguish between delivered and seen notifications. Mostly, push notification services teams show only the delivery rate but not the view rate. But in the Gravitec.net service, we strive to fully inform our customers about what is happening in their push campaigns, so we show both rates.
- A notification is considered delivered, if a push notification server identifies a subscriber as active, and confirms that your notification can be received by this subscriber.
- A notification is seen when a subscriber’s device actually receives it, i.e., your notification is displayed on the subscriber’s device.
Learn more about push notification metrics.
So, the delivery rate is a ratio between the number of delivered and sent notifications. On average, the push notifications delivery rate in the Gravitec.net service is up to 99%.
The average view rate is a ratio between seen and delivered notifications. The benchmark of this rate is 35-60% depending on the industry and parameters of a push campaign. The view rate for a particular campaign largely depends on the time when you send notifications and TTL (Time push to live) — the preset period while the push service is trying to connect with a subscriber’s device.
On average, in 2022, the view rate for campaigns sent in the afternoon and the evening is twice higher than for campaigns sent in the night and the early morning. Regarding TTL, the highest CTRs had campaigns with the TTL that exceeded 6 hours. However, if your campaign is time sensitive, such as when you promote a sale that lasts for one hour, you need to consider shortening your TTL to not more than one hour.
Click through rate for various campaign types
Click-through rate (CTR) is the ratio between the number of opened and delivered notifications. It reflects how your subscribers react to your campaigns. The CTR largely depends on the notification content and its relevance to subscriber interest. That is, segmentation is crucial for attaining high campaign results. Also, there is a correlation between the CTR and the type of notification, i.e., whether you use rich push notifications with big images and buttons or standard notifications with small icons.
Here is the average CTR for different types of campaigns.
- CTR for campaigns segmented by tags was roughly 5%.
- The average CTR for campaigns sent to subscribers segmented by standard filters, such as by country and browser, was around 3%.
- CTR for campaigns to all subscribers was around 2,5%.
- CTR for campaigns with aliases was roughly 5%.
Also, note that CTR for notifications with big images was seven times higher than for push notifications with small icons.
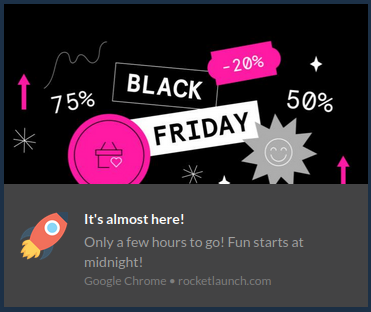
Rich push notification
As with the delivery rate, click-through rates depend on when you send campaigns. Here is a chart that shows how the number of clicks depends on the hour of the day.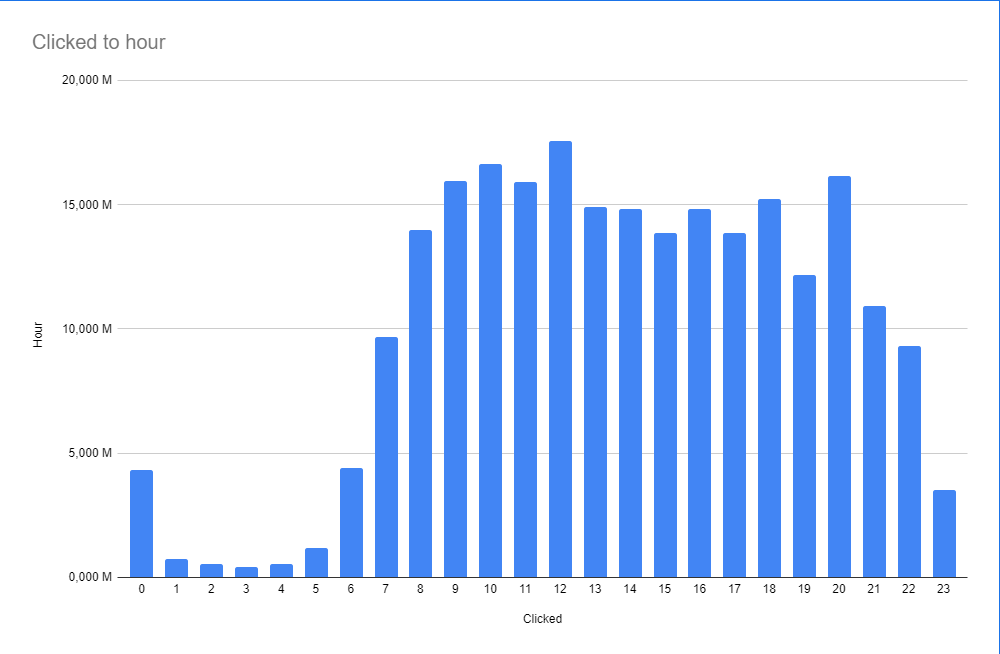
As we can see, the highest CTR values were detected from 8 am to 8 pm.
Close rate for targeted and general campaigns
The close rate shows how many subscribers click the close button when receiving a push notification. The average close rate in 2022 for standard campaigns was 30%. At the same time, for push campaigns with custom tags it was roughly 20%. It shows that targeted campaigns were more relevant for subscribers than campaigns sent to all subscribers.
Finally, let us summarize the above information into final conclusions.
Summary
- Push notifications can reach roughly 85% of all internet users
- Within the first three months after the installation of push notifications, the number of subscriptions for a website grows by up to 300%.
- The push notification opt-in rate depends on the industry. On average, it is roughly 5% for e-commerce websites and 6-8% for media websites.
- 90% of all push subscribers use mobile devices to subscribe to push notifications.
- 95% of all push subscribers receive notifications via Chrome.
- The average delivery rate for push notifications is roughly 99%.
- Benchmarks for the push notification view rate is 35-60%.
- Push notifications sent in the afternoon the evening had twice higher view rate than campaigns sent in the night and the early morning.
- Campaigns with TTL above 6 hours had the highest view rates.
- Targeted push campaigns with custom tags were two times more effective than campaigns sent to all subscribers (5% to 2,5% CTR respectively).
- Rich push notifications are seven times more effective than standard campaigns.
- Campaigns sent to all subscribers have a 30% close rate, and campaigns sent to tagged subscriber segments have a 20% close rate.
- The best time to send push notifications to get the best CTR is from 8 am to 8 pm.
See how push notifications helped a Dutch science-popular website get 200,000 additional views.
If you have any questions about the technology features or a push campaign launch, please, contact our support team.
TIP
What is the average delivery rate for push notifications?
The average delivery rate for push notifications in the Gravitec.net service is approximately 99%. This means nearly all notifications sent are confirmed as received by the subscriber’s device.
Are targeted campaigns more effective than general ones?
Yes, targeted campaigns segmented by custom tags achieve a click-through rate (CTR) of 5%, compared to 2.5% for campaigns sent to all subscribers. Targeting ensures notifications are more relevant to subscribers.
What’s the best time to send push notifications for high engagement?
The highest click-through rates (CTR) are observed between 8 am and 8 pm. Notifications sent during this time see significantly better engagement than those sent late at night or early in the morning.