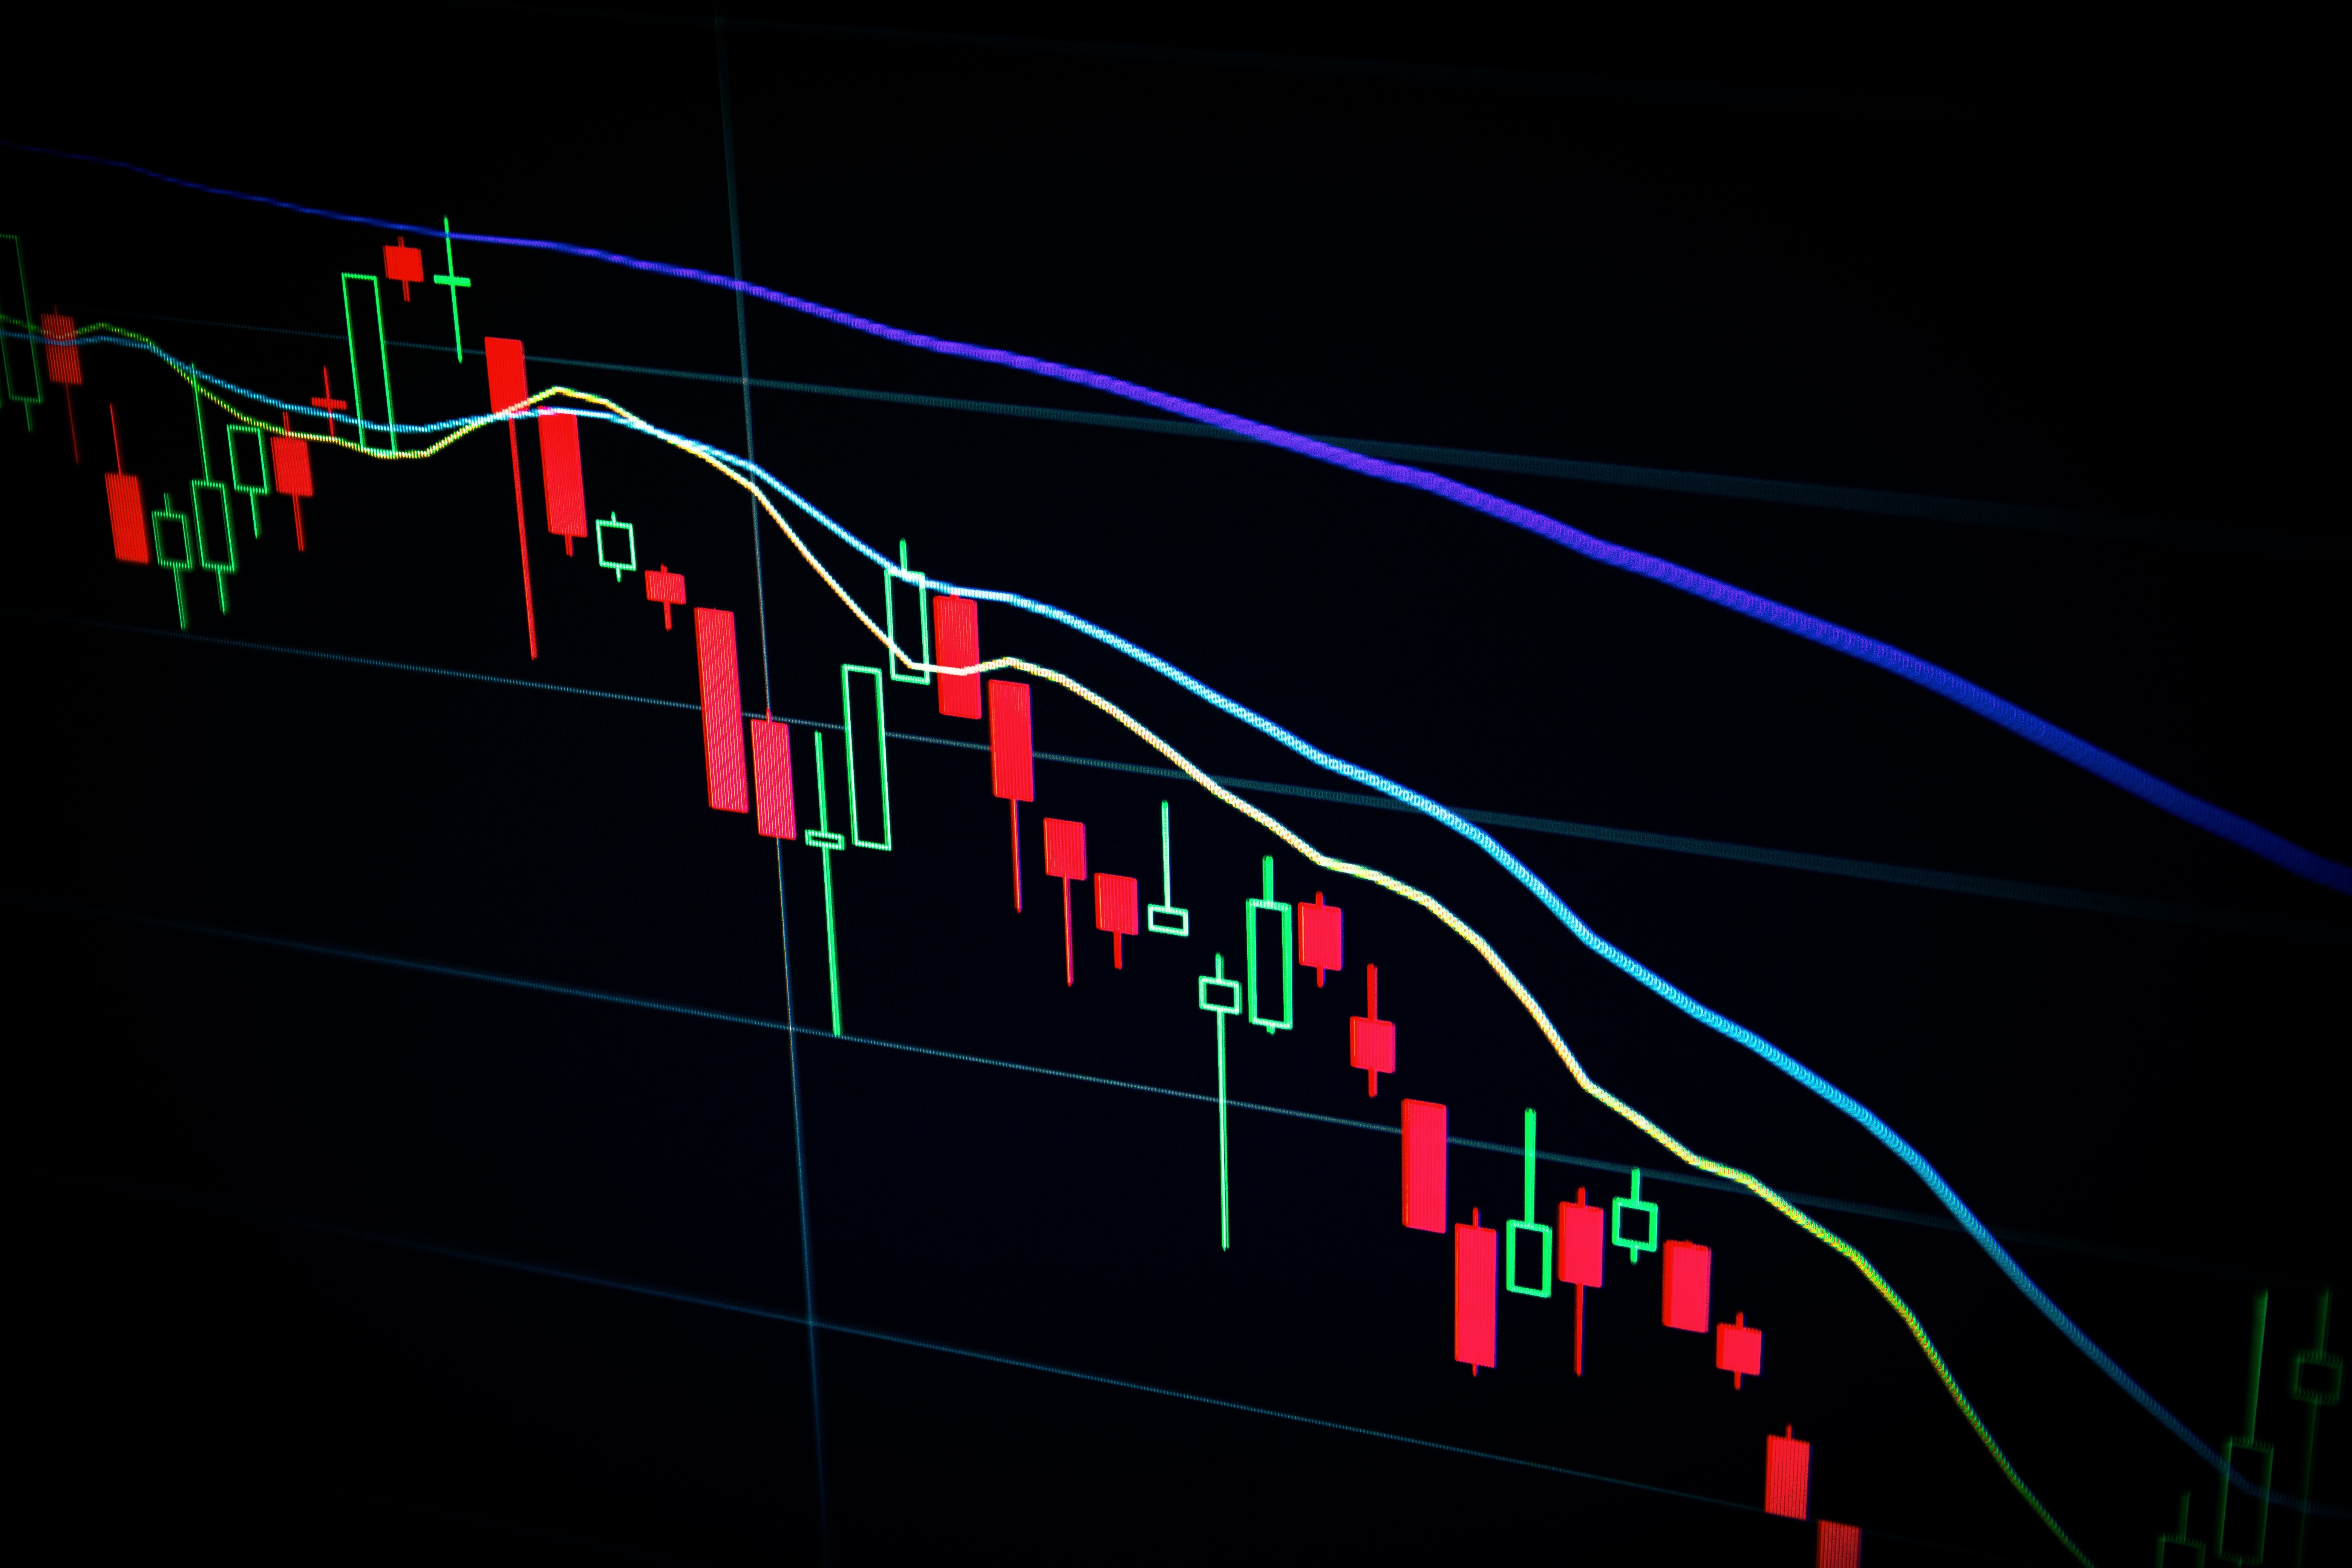
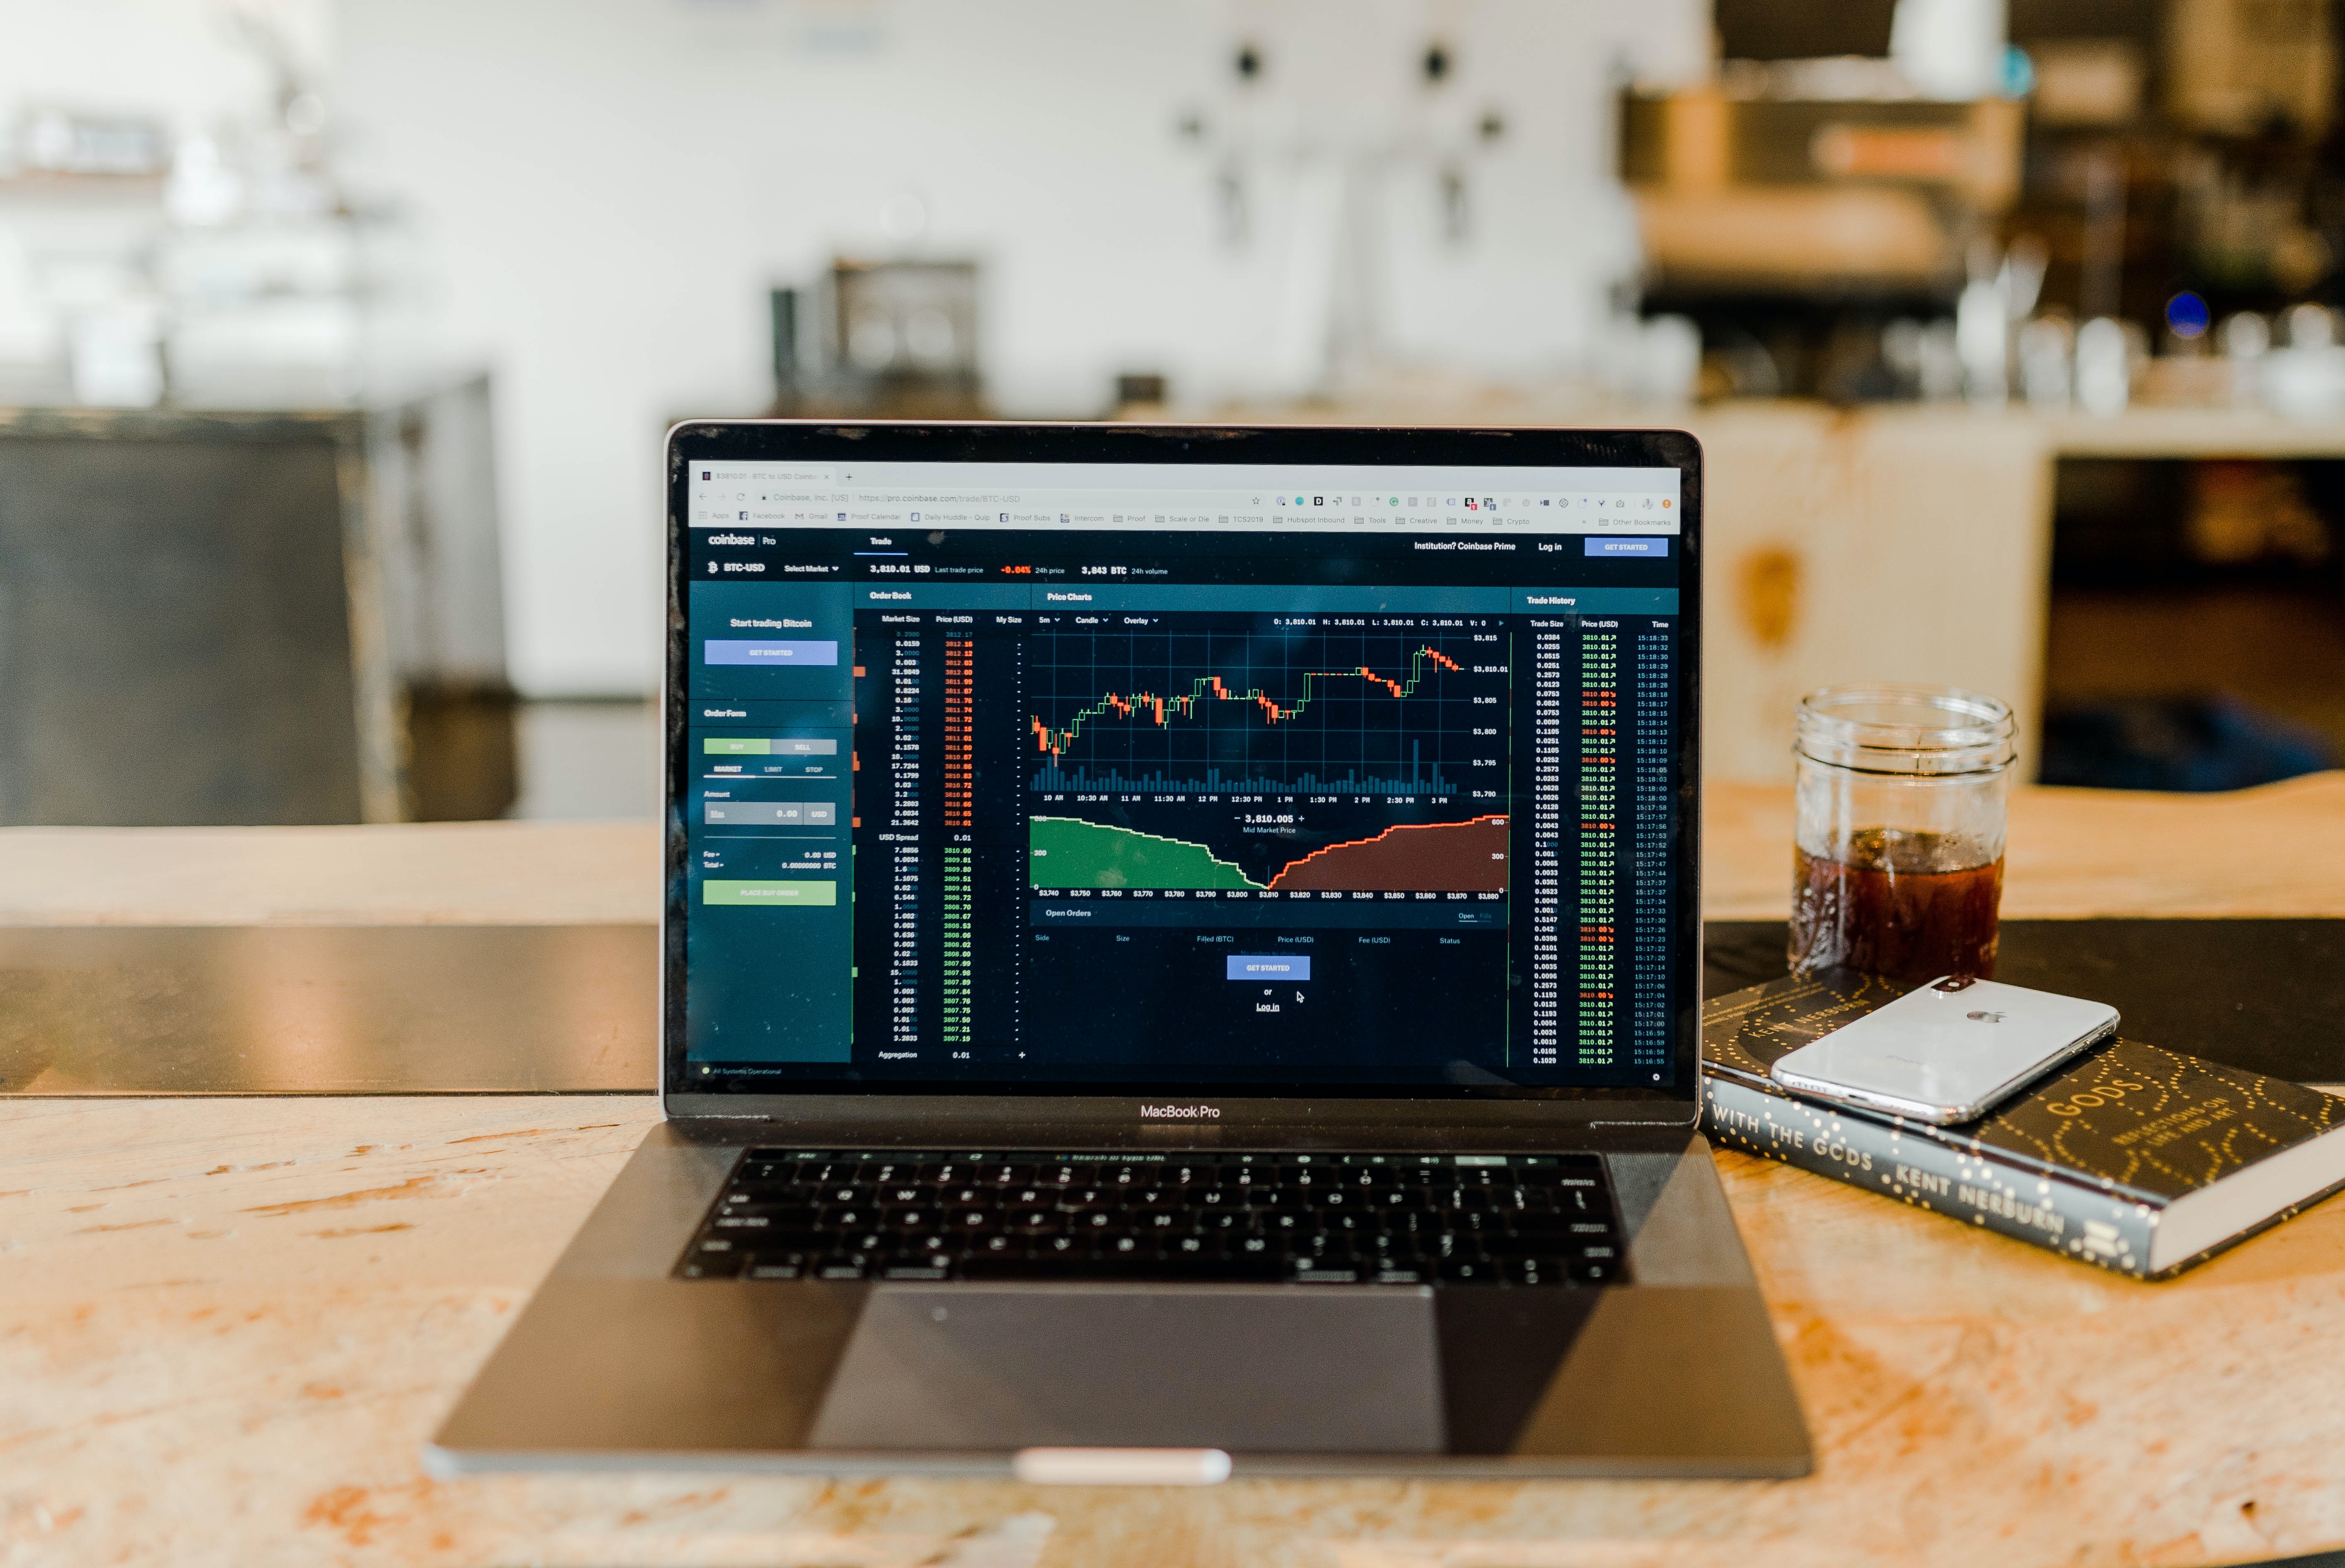
Trading technical indicators alerts and notifications are crucial in the world of trading. Technical indicators are mathematical calculations based on the price and/or volume of a security, which can provide traders with valuable insights into market trends and potential price movements. By using indicators in combination with alerts and notifications, traders can stay informed about market changes and take advantage of trading opportunities in real-time.
Indicator alerts are one of the most popular ways to use technical indicators in trading. These alerts can be customized to trigger when certain conditions are met, such as when a stock price crosses a moving average or when the relative strength index (RSI) reaches a certain level. Traders can also create their own trigger settings using alert conditions and alert functions. Indicator alerts can help traders stay on top of market trends and make informed trading decisions.
Another way to use technical indicators in trading is through automated trading systems. These systems use quantitative analysis to identify trading opportunities and automatically execute trades based on pre-set rules. Traders can set up alerts and notifications to receive updates on their automated trading systems and adjust their strategies as needed. With the help of technical indicators and alerts, traders can stay informed and make profitable trades in the fast-paced world of trading.
Understanding Trading Technical Indicators
Technical indicators are mathematical calculations based on the price, volume, or open interest of a security or contract used by traders who follow technical analysis. Technical indicators may form the basis for automated trading systems given their quantitative nature. Technical indicators are used to see past trends and anticipate future moves.
There are many types of technical indicators, but some of the most commonly used ones include moving averages, relative strength index (RSI), on-balance volume (OBV), and MACD. These indicators can be used to identify trends, momentum, and potential reversals in the market.
Moving averages are one of the most basic technical indicators and are used to smooth out price data by creating a constantly updated average price. They can be used to identify trends and potential support and resistance levels.
The RSI is a momentum indicator that measures the strength of a security’s price action. It is used to identify overbought and oversold conditions and can be used to confirm other forms of technical analysis.
The OBV is a volume-based indicator that measures buying and selling pressure. It can be used to identify potential trend reversals and can be combined with other indicators to confirm signals.
The MACD is a trend-following momentum indicator that shows the relationship between two moving averages. It is used to identify potential trend reversals and can be combined with other indicators to confirm signals.
Alerts and Notifications in Trading
Alerts and notifications are crucial tools for traders to stay on top of the market and make informed decisions. With real-time price alerts, traders can receive notifications when the market meets their custom criteria, whether it be a specific price target, technical indicator, or news event. This allows traders to react quickly to changing market conditions and take advantage of opportunities as they arise.
Trading platforms like TradingView offer a variety of alert types, including price alerts, indicator alerts, strategy alerts, and drawing alerts. Traders can also create custom alerts based on their specific trading strategies and preferences. These alerts can be delivered through various channels, such as email, push notification, SMS, and more.
Indicator alerts are particularly useful for traders who rely on technical analysis. By setting up alerts for specific indicators, traders can receive notifications when a buy or sell signal is generated. This allows them to make quick decisions based on the indicator’s signals and take advantage of potential profit opportunities.
Strategy alerts are also useful for traders who use automated trading systems. By setting up alerts for specific trading strategies, traders can receive notifications when the system generates a buy or sell signal. This allows them to monitor their automated trading systems and make adjustments as needed.
Drawing alerts allows traders to draw their own alerts on the chart. They can draw trendlines, support and resistance levels, and other important chart patterns. When the market reaches these levels, traders can receive notifications, allowing them to make informed trading decisions.
Using Trading UI
TradingView’s user interface (UI) is designed to be user-friendly and intuitive. It offers various tools and features that allow traders to set up alerts and notifications for technical indicators. Below are some of the key elements of the TradingView UI that can help traders set up alerts and notifications.
Screen and Desktop
TradingView can be accessed through a web browser on any device, including desktops, laptops, tablets, and smartphones. The platform is optimized for desktop and laptop screens, but it is also responsive and works well on smaller screens.
Drawing Objects and Drawing Panel
TradingView’s drawing tools allow traders to draw trend lines, support and resistance levels, and other technical indicators on their charts. The drawing panel is located on the right side of the chart and can be accessed by clicking the “Drawing Tools” button.
Plus Button
The plus button is located next to the current price on the price scale. Clicking it opens a menu that allows traders to add various technical indicators to their charts, including moving averages, Bollinger Bands, and more.
Idea Title
The idea title is located at the top of the chart and can be used to set up alerts and notifications for specific technical indicators. Traders can click the “Create Alert” button next to the idea title to set up an alert.
Frequency
Traders can choose the frequency of their alerts, including once per bar, once per minute, once per hour, and more. The frequency can be set in the alert settings.
Notify on App, Send Email, and Webhook URL
Traders can choose to receive alerts and notifications on the TradingView app, via email, or through a webhook URL. These options can be set in the alert settings.
Play Sound
Traders can choose to play a sound when their alert is triggered. This option can be set in the alert settings.
Overall, TradingView’s UI offers a wide range of tools and features that allow traders to set up alerts and notifications for technical indicators. By using these tools effectively, traders can stay on top of market trends and make informed trading decisions.
Setting Alerts for Price Movements
Investors and traders often use technical indicators to help them make informed decisions about buying and selling securities. One of the most important aspects of using technical indicators is setting alerts to notify them of significant price movements. Alerts can help investors monitor news and markets, and they can be set up to monitor the price of a particular investment, the percentage change since the previous close, moving averages, and 52-week high/low.
Setting price alerts is an essential part of technical analysis, and it can be done through various platforms and applications. When setting up price alerts, investors can choose to receive notifications via email, text message, or push notifications. The following are some tips for setting up alerts for price movements:
- Less Than: Investors can set alerts for when the price of a security falls below a certain level. This is useful for investors who want to buy a security at a lower price than what it is currently trading for.
- Moving Up: Investors can set alerts for when the price of a security starts moving up. This can help investors identify potential buying opportunities and get in on the action before the price goes up too much.
- Price Alert: Investors can set alerts for when the price of a security reaches a certain level. This is useful for investors who want to sell a security when it reaches a certain price point.
- Set Alert: Investors can set alerts for when a security’s price moves a certain percentage from the previous close. This can help investors identify potential buying or selling opportunities.
Overall, setting up alerts for price movements is an essential part of technical analysis. It helps investors monitor news and markets and identify potential buying or selling opportunities. By setting up alerts, investors can stay on top of all investing information without having to monitor the markets all the time.


